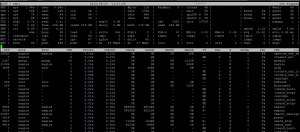
AT Computing System & Process Monitor (atop)
The program atop is an interactive monitor to view the load on a Linux system. It shows the occupation of the most critical hardware resources (from a performance point of view) on system level, i.e. cpu, memory, disk and network.It also shows which processes are responsible for the indicated load with respect to cpu- and memory load on process level. Disk load is shown if per process “storage accounting” is active in the kernel or if the kernel patch âcntâ has been installed. Network load is only shown per process if the kernel patch âcntâ has been installed. Every interval (default: 10 seconds) information is shown about the resource occupation on system level (cpu, memory, disks and network lay-ers), followed by a list of processes which have been active during the last interval (note that all processes that were unchanged during the last interval are not shown, unless the key âaâ has been pressed). If the list of active processes does not entirely fit on the screen, only the top of the list is shown (sorted in order of activity). The intervals are repeated till the number of samples (specified as command argument) is reached, or till the key âqâ is pressed in interactive mode.
When atop is started, it checks whether the standard output channel is connected to a screen, or to a file/pipe. In the first case it produces screen control codes (via the ncurses library) and behaves interactively; in the second case it produces flat ASCII-output.
- PRC: Total CPU time in system and user mode, total number of processes and of zombie processes, and the number of processes that exited during the polling interval. The default polling interval is 10 seconds. Use ‘i’ to change it interactively or ‘z’ to pause it.
- CPU and CPL: CPU utilization and load (averaged over 1, 5 and 15 minutes).
- MEM and SWP: Amount of memory and swap space that is available and where it’s allocated. vmcom and vmlim show how much virtual memory space is committed and what the limit is.
- DSK: disk utilization. avio shows the average number of milliseconds per request.
- NET: Network utilization for the TCP layer (“transport”), the IP layer (“network”) and each interface.
Installing atop
Atop rpm can be found here : http://packages.sw.be/atop/ If you are using fedora/Centos you can use YUM to install it.
- yum install epel-release
- yum install atop -y
You can also install atop from source by download it from http://www.atoptool.nl/download/atop-1.25.tar.gz
Atop Help :
Scheduling information — key ‘s’
Memory consumption — key ‘m’
Disk utilization — key ‘d’
Variable information — key ‘v’
Command line — key ‘c’
Accumulated per program — key ‘p’
Accumulated per user — key ‘u’
Network utilization — key ‘n’ (patched kernel)
SceernCaps :
Useful links :
Install Htop to monitor your server

